
March Planning Update: A Review of Market Volatility and Planning Principles
Given the market volatility this past month, I thought it made sense to compile data and review the principles that are so important to the plans we build.
While volatility is normal and always easy to talk through when markets are doing well, periods of stress always come with scary headlines. While it can be tempting to think, “this time is different,” it’s important that we reinforce these principles to help you build and maintain wealth over time….
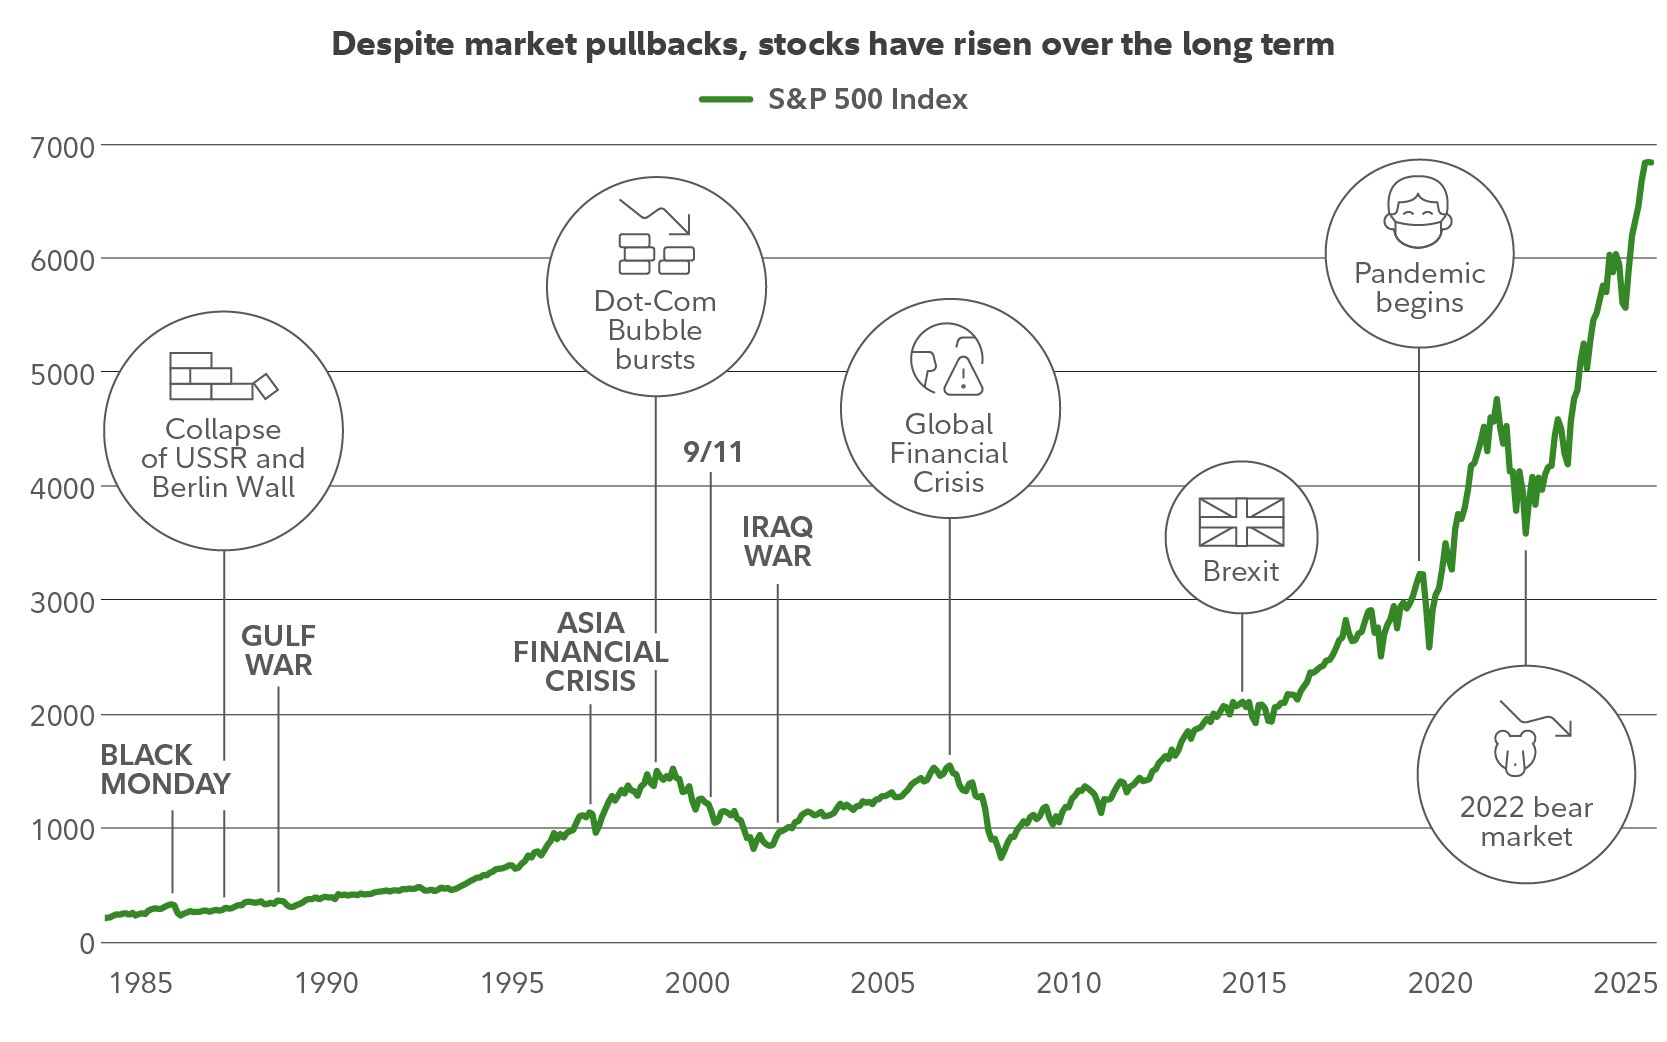
Here’s a chart from Fidelity Investments of the market over time with a few of the real-world events that were happening during those periods of volatility since the 80’s.
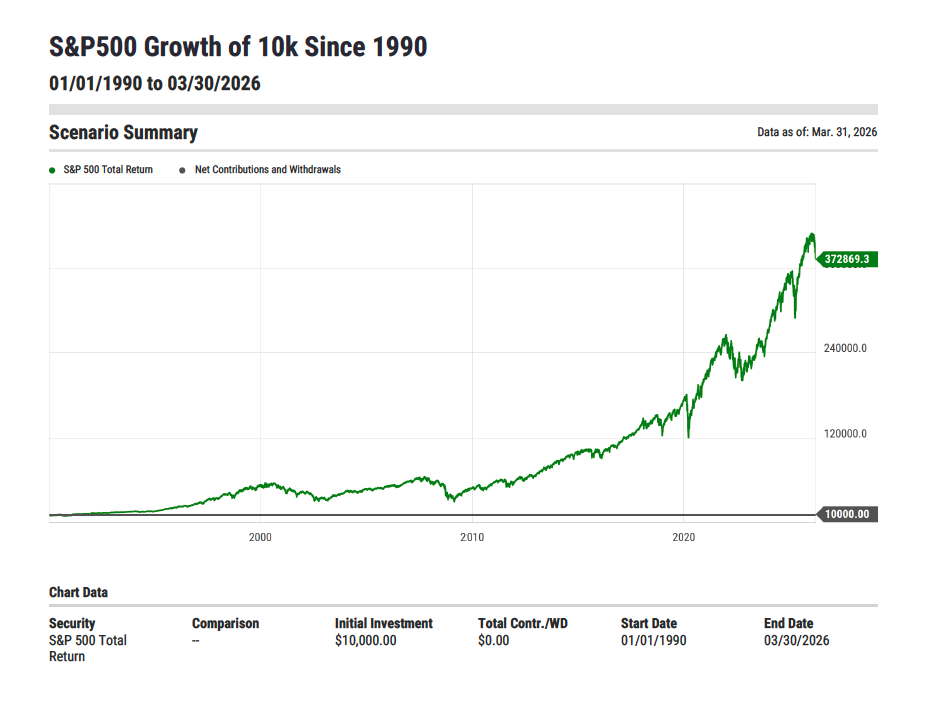
To put some numbers to this, had you invested $10,000 invested in the S&P500 index in 1990 and left it alone, you would have sat through one of the worst periods of time in market history (2000-2010, the lost decade) and you would have over $370,000 today (and you thought the house prices had gone up a lot since then!). That’s a 37x return on your money in less than 40 years.
Here are a few more statistics to help contextualize short-term volatility.
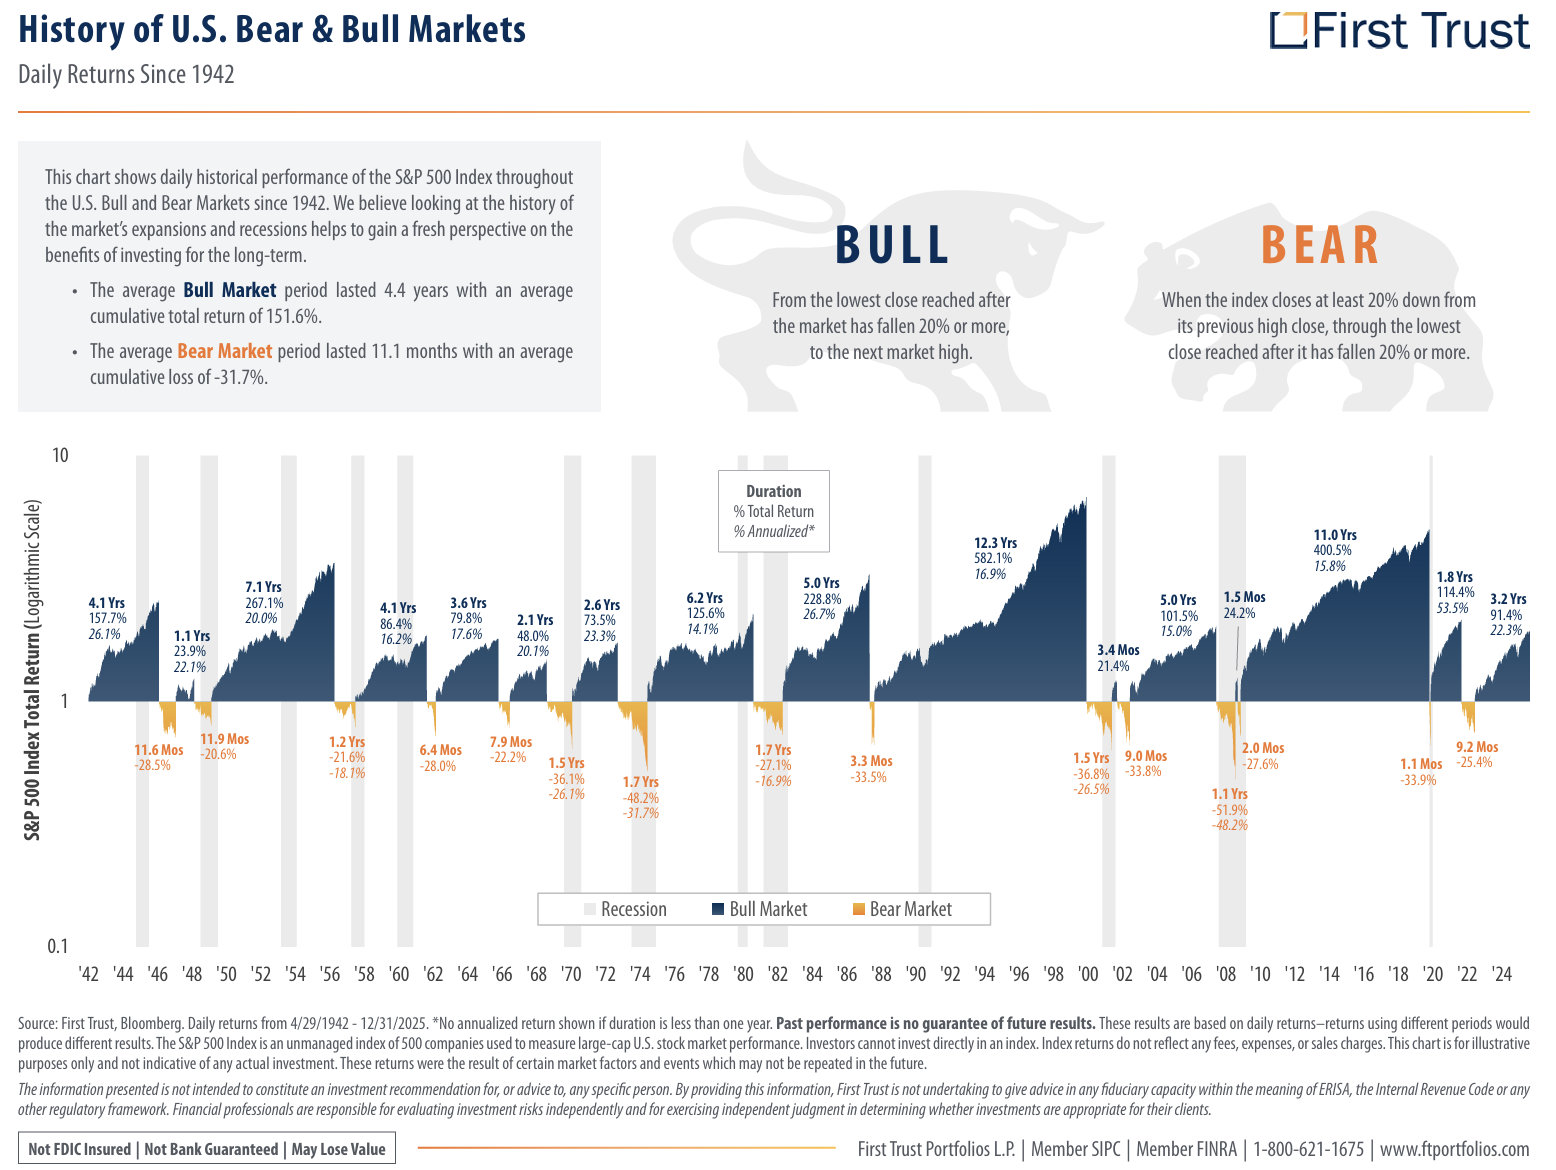
According to First Trust, since 1946 (through the end of 2025) the average bull market lasted about 4.5 years and had an average total return of 152%. Bear markets, on the other hand, lasted about a year and averaged -32%. We are now about 3 years into the most recent bull market that started after the drawdown due to interest rate hikes in 2022.
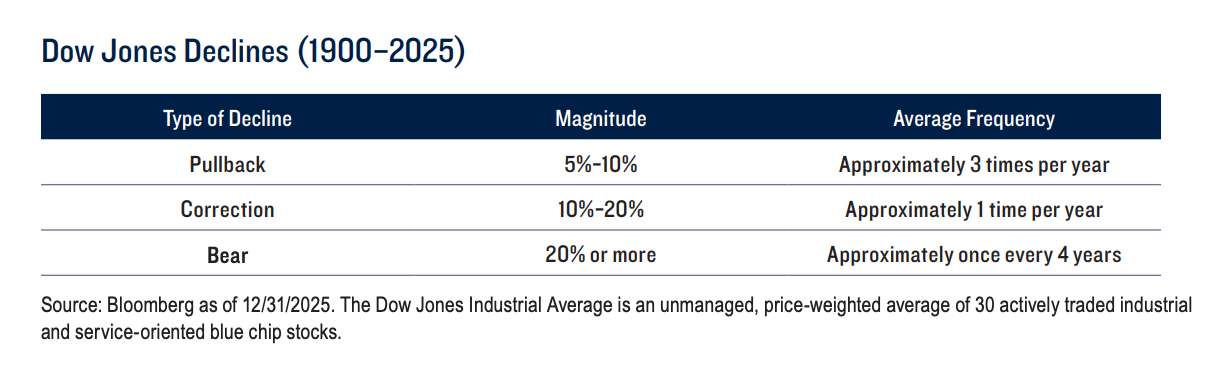
While every downturn can feel like the beginning of a new bear market, market drawdowns are much more common than bear markets. In fact, a 5-10% pullback happens about 3x/year on average historically, with a 10-20% pullback happening about 1x/year, and a bear market happening on average about every 4 years.
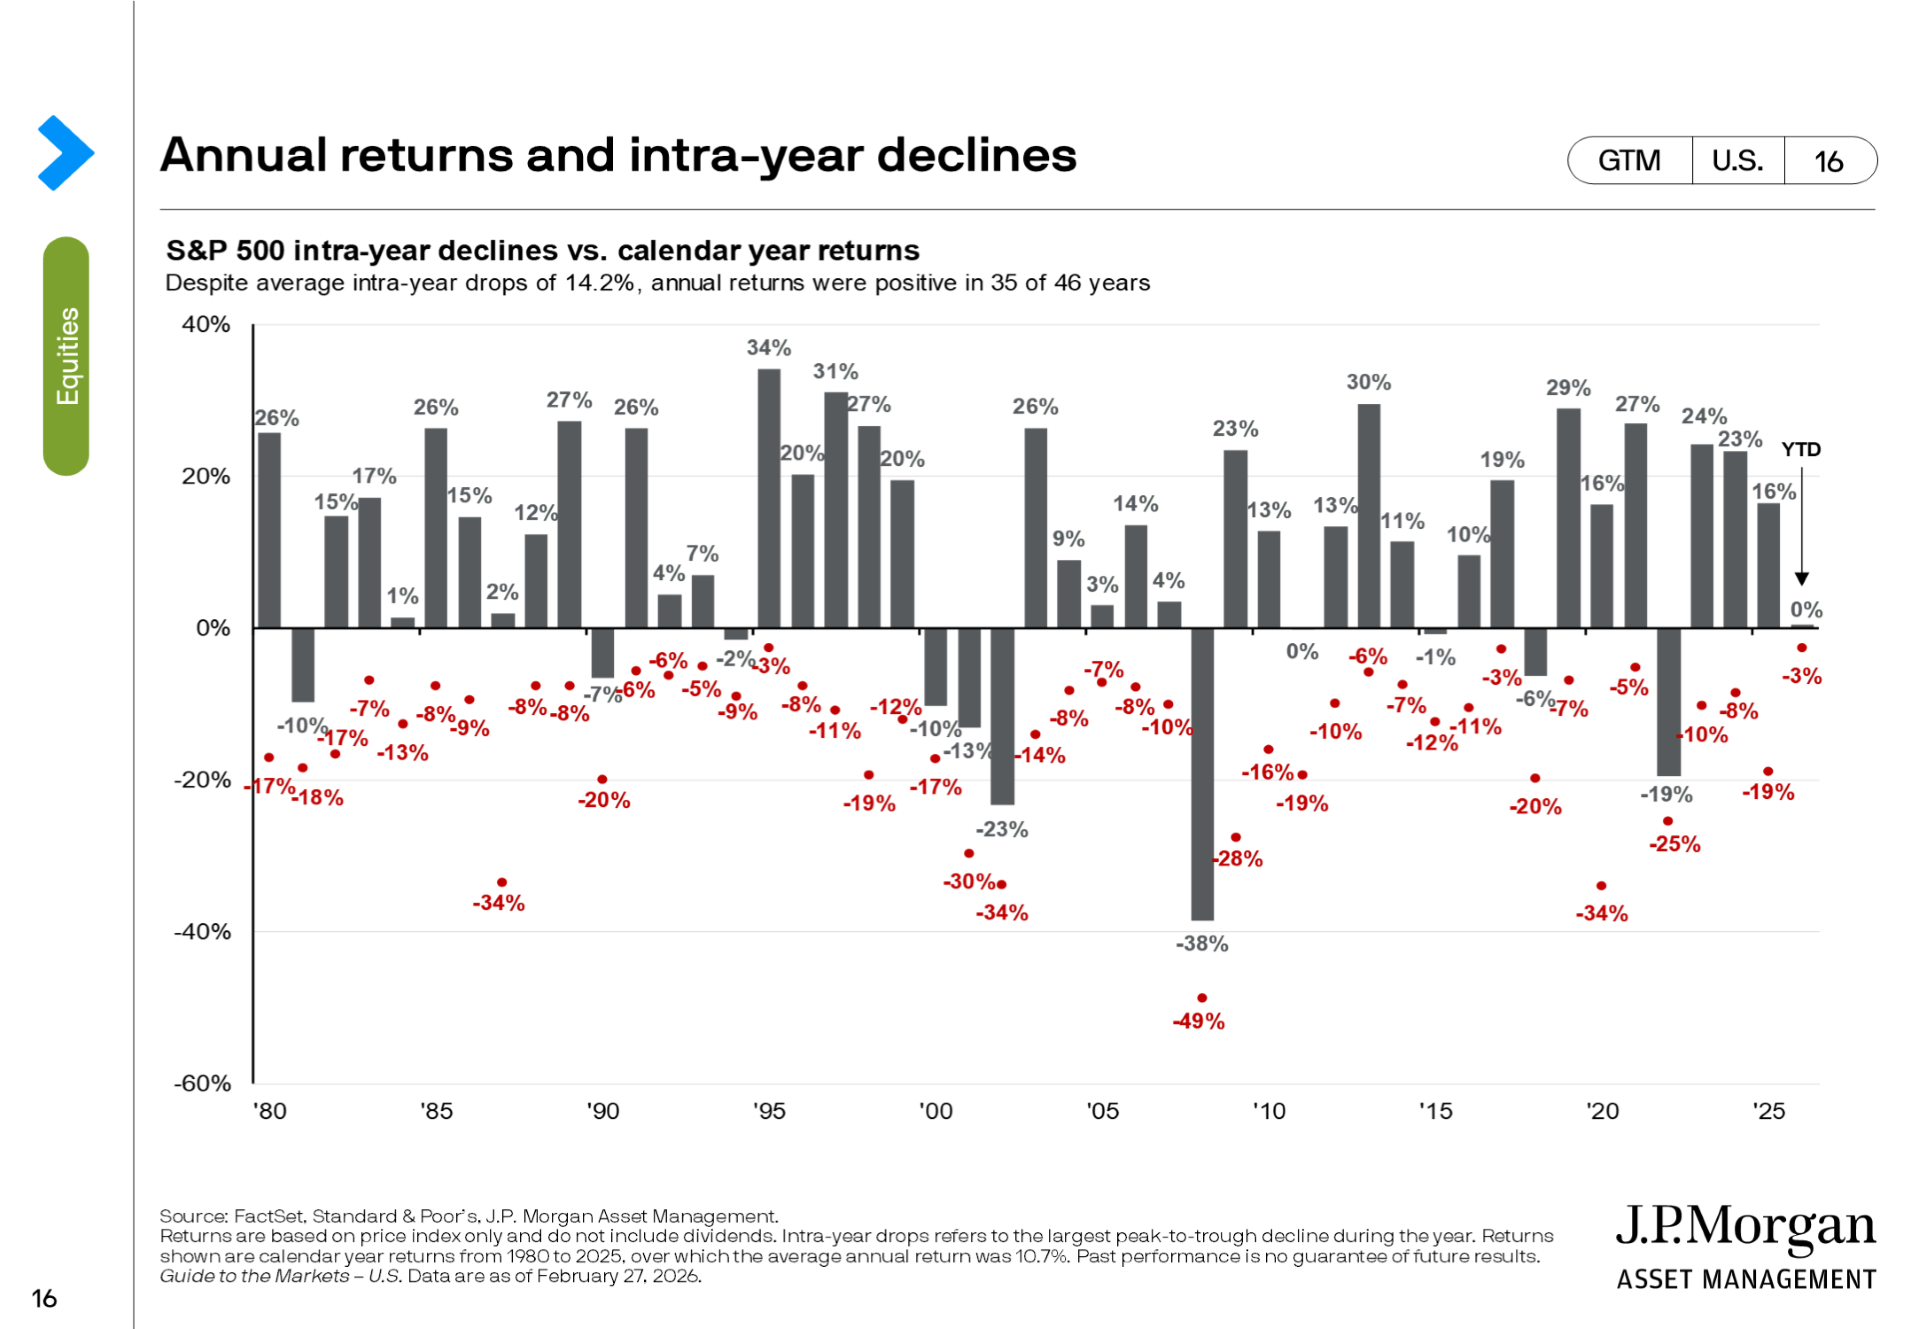
This chart shows the largest intra-year decline (the red dots) vs the annual return for stocks (the gray bars). What you may notice is that the average largest decline in any given year is about 14% while the market is positive for the year over 3/4ths of the time and having returned.
Ultimately, the biggest risk to the financial plan is human behavior. According to a recent article by Forbes the average investors returns have been about 3-4% less per year than the market itself over the last decade due to emotion. Staying invested during periods of scary headlines and market meltdowns is not something that we were pre-wired to do. It goes against our evolved instincts of self-preservation, but it doesn’t mean it’s not a worthwhile endeavor. This is why we feel it’s so important to have a plan and an advisor to help visualize and put context to your plan in the long run, fighting back on those human reflexes.
We are here for you if you have any questions or anxieties at all. Our job is to help ensure that you have a plan in place that does not rely on luck or short-term market performance and work that plan over time to accomplish the most important things in your life.
Brent Gargano, CFP®
Founder and Financial Advisor of Infinite Wealth Planning


Thanks For Reading! We Hope To See You Again!
For More Updates:

Advisory services offered through National Wealth Management Group, LLC, a Registered Investment Adviser. This information is intended for educational purposes and is not intended as a recommendation to buy or sell securities. Investing involves risk. Before investing, you should consult with a financial advisor to determine how a specific investment strategy fits your personal goals and objectives.
![]()